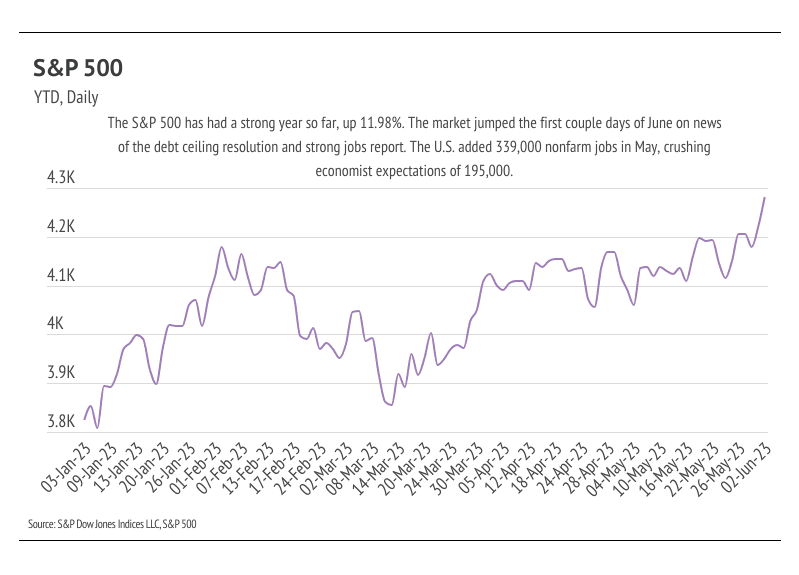
We did it, gang! We made it through another debt ceiling crisis! The United States paid its bills in full and on time, avoiding default and a global economic catastrophe with two days to spare. This self-inflicted wound would have had far-reaching negative economic consequences in the near and long term, including far higher mortgage rates. Financial markets were mostly unbothered despite the fact that this Congress seems to be the most amenable to default. The 10-year Treasury yield rose a modest 0.4% in May, which translated to a 0.4% increase in the average 30-year mortgage rate. The S&P 500, which tracks the stock of the 500 largest publicly traded U.S. companies, reached a high for the year at the beginning of June, up 12% year to date. To be fair, a debt ceiling resolution that didn’t totally destroy the U.S.’s global standing was the most probable scenario. Now that the debt ceiling has been lifted until 2025, we turn our sights back to the Fed and interest rates.
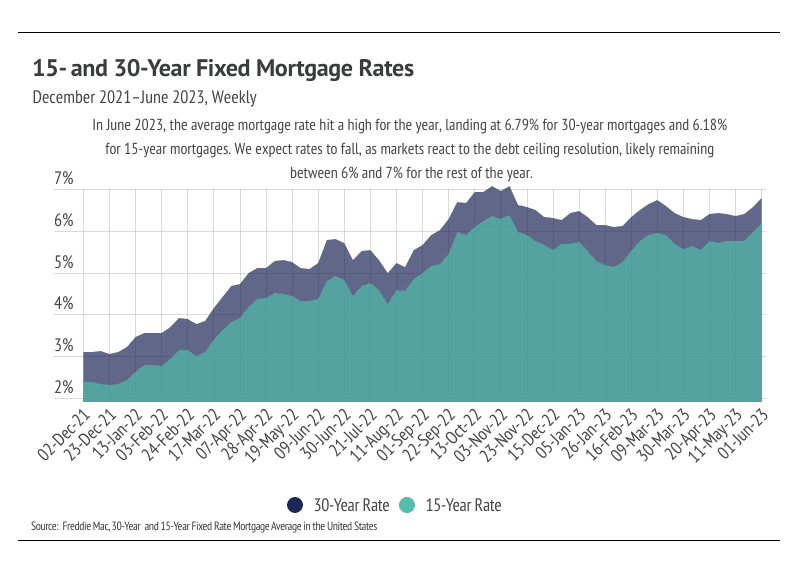
During their last meeting, the Fed forecasted a potential pause in rate hikes after three sizable regional bank failures this year, but recent jobs data may swing them back toward a 0.25% increase. Increasing mortgage rates have primarily driven the housing market slowdown we’ve experienced over the past 12 months. Higher rates affect the housing market so strongly because housing is typically financed. Potential buyers have struggled with mortgage rate volatility over the past 18 months, as the average 30-year mortgage rate went from historic lows in 2021 (~3%) to a 20-year high (~7%) in November 2022. Luckily, rates contracted but have remained around 6.5%. Because home prices nationally haven’t contracted substantially from their all-time highs, small rate changes can make a huge difference in the cost of financing. The average 30-year rate hit a 2023 high at the start of June. However, we still expect rates to stay within the 6-7% band this year. At this point, continued rate hikes tell us more about the length of time rates will stay high, since the Fed tends to move in smaller steps over time. This means that, for every step up, there will need to be a step down, which will prolong the process of returning to lower mortgage rates.
The Fed has a tricky decision regarding future rate hikes. The broad labor market has shown its strength and seeming immunity to rate hikes. The monthly increase in employment from the U.S. Bureau and Labor Statistics has beat Wall Street estimates for the 14th month in a row. In May alone, 339,000 jobs were created, crushing the expected 195,000 jobs. At the same time, however, unemployment rose from 3.4% to 3.7% from April to May. Additionally, the first-quarter 2023 GDP data was revised up from 1.1% to 1.3% quarter over quarter. With this mix of data, we’re expecting a rate hike pause at the June meeting, but a hike again in July.
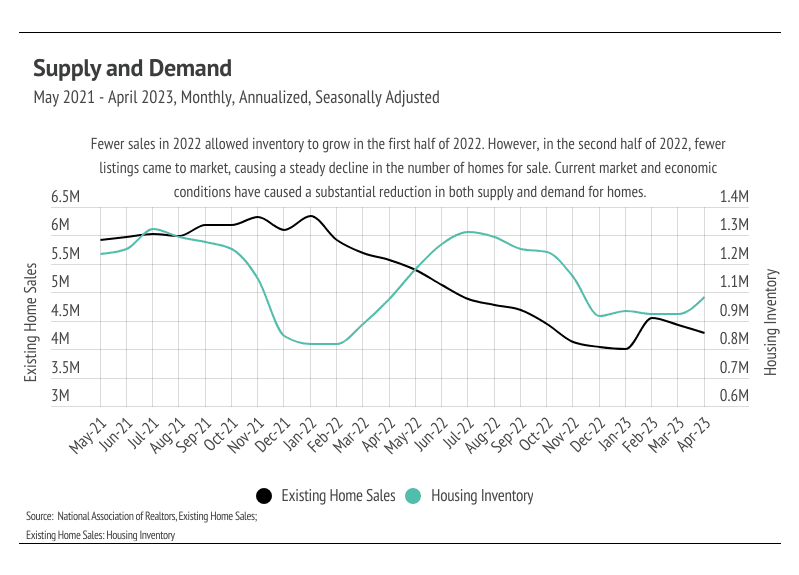
The housing market is in an interesting spot, where the economy is too good to lower rates but homes have become too expensive for potential buyers. Fewer sellers and buyers are in the market, so sales are unlikely to grow meaningfully this year.
Different regions and individual houses vary from the broad national trends, so we’ve included a Local Lowdown below to provide you with in-depth coverage for your area. In general, higher-priced regions (the West and Northeast) have been hit harder by mortgage rate hikes than less expensive markets (the South and Midwest) because of the absolute dollar cost of the rate hikes and the limited ability to build new homes. As always, we will continue to monitor the housing and economic markets to best guide you in buying or selling your home.
-----
Big Story Data

-----
The Local Lowdown
-
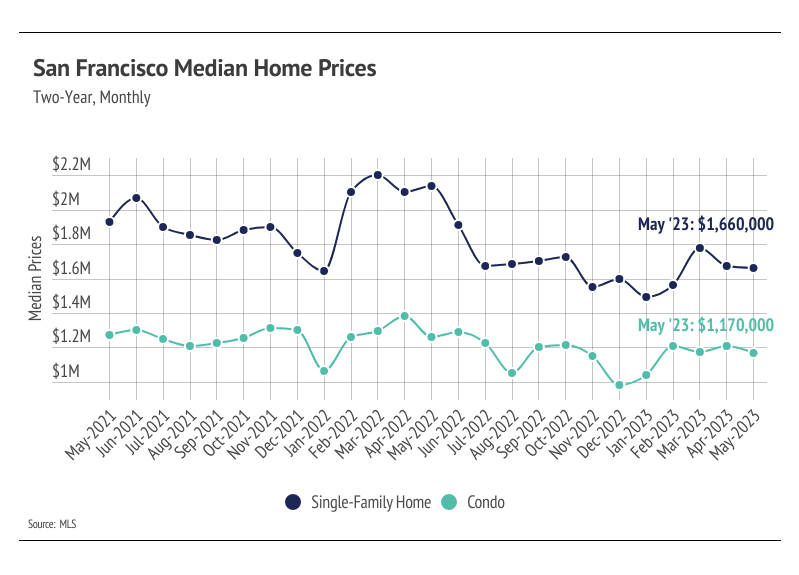
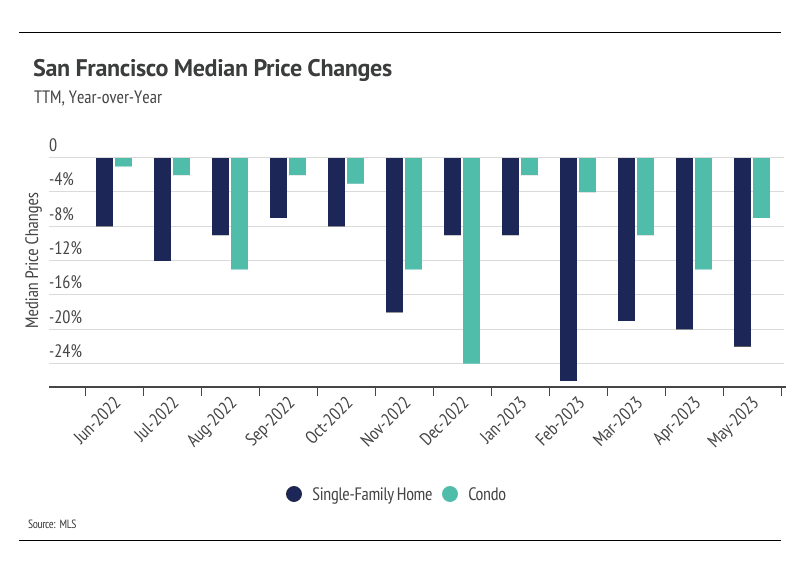
Year to date, median single-family home and condo prices are still up, despite falling in May. Over the past 24 months, however, prices and inventory have followed a similar pattern of decline.
-
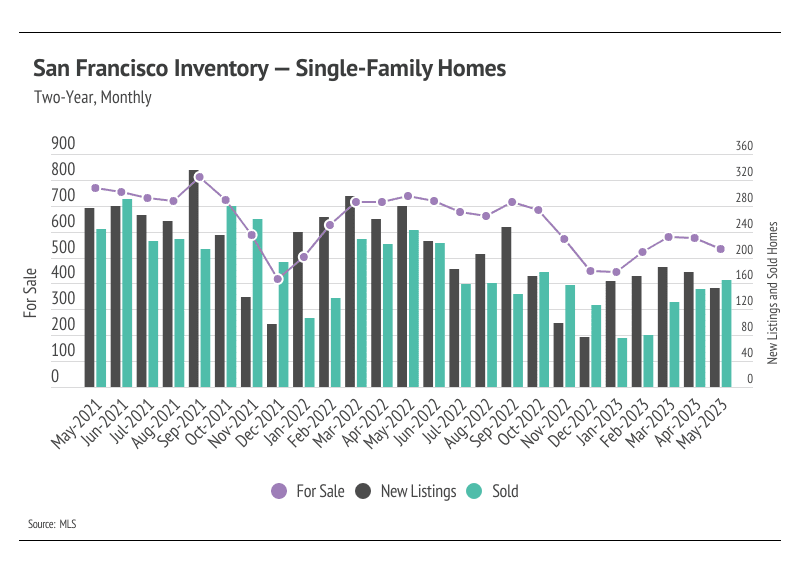
Active listings in San Francisco fell in May, continuing the two-year trend, as sales increased and fewer than usual new listings came to market.
-
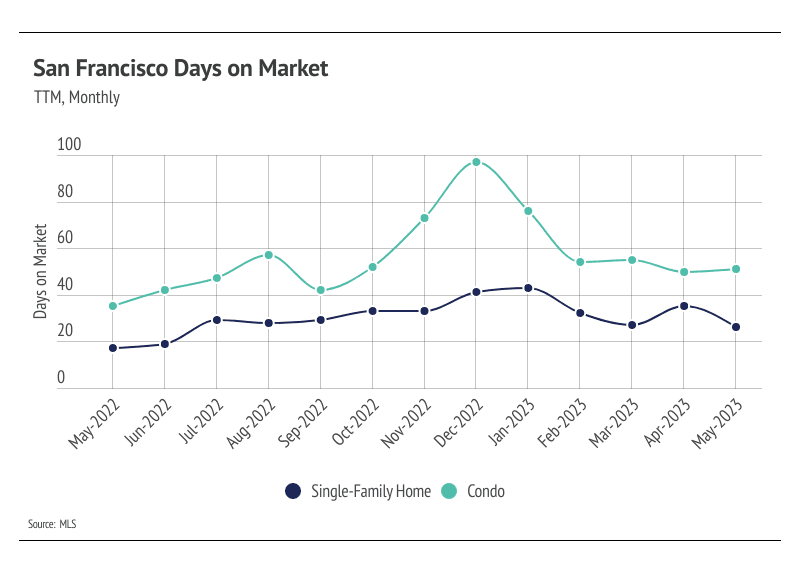
Months of Supply Inventory has declined significantly in 2023, homes are selling more quickly, and sellers are receiving a greater percentage of asking price, all of which highlight an increasingly competitive environment for buyers.
Note: You can find the charts/graphs for the Local Lowdown at the end of this section.
-----
Low inventory hurting price growth
Increasing demand and low inventory are once again driving the rapid home price appreciation that San Francisco has experienced this year. Last year, single-family home prices peaked in April, and condo prices peaked in May, as buyers rushed to lock in a lower mortgage rate, but this was followed by a return to the longer-term trend of decline. San Francisco was one of a handful of markets that didn’t benefit strongly from the pandemic homebuying boom, seeing more people migrate out of the city than in. Once people were ready to come back, the Fed announced rate hikes at the end of 2021 that would swiftly affect rates in 2022. The average 30-year mortgage rate rose 2% in the first four months of 2022, crossing 5% for the first time since 2011. That 2% jump caused the monthly cost of financing to increase 27%, so buyers rightly rushed to the market. As rates rose higher, the market cooled and home prices fell in large part to accommodate the higher cost of a mortgage. Both supply and demand were lower than normal in the second half of 2022. However, in 2023, demand started to rise again despite elevated mortgage rates, but it wasn’t met with the typical number of new listings because people either bought at a hyper-low rate in 2021 or refinanced at a low rate.
This year, the number of new listings has been significantly lower than usual compared to sales growth. Typically, inventory grows in the first half of the year as new listings significantly outpace sales. At this point, inventory levels can’t make up for low growth in the first five months of 2023, keeping supply of homes and, in turn, sales depressed for the rest of the year. The limited number of listings is especially challenging in luxury markets where homes sell in the millions of dollars. Homebuyers, understandably, only want the right home for their money.
-----
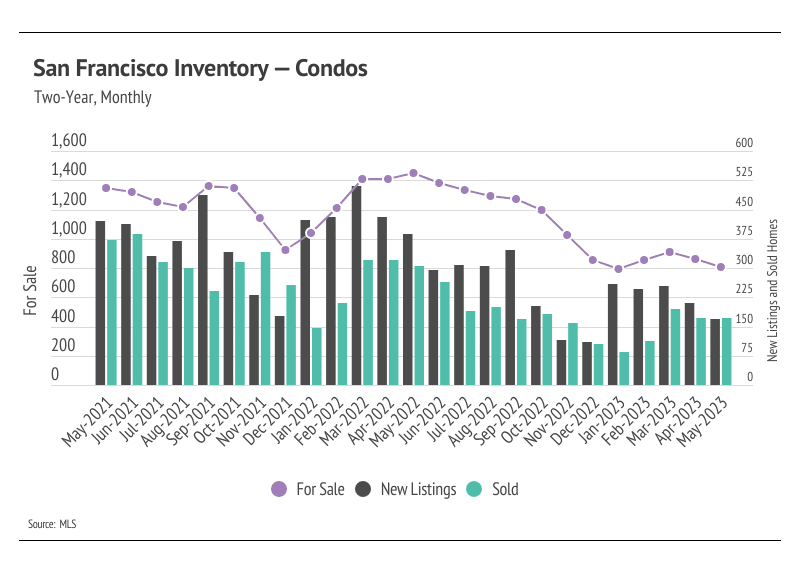
Inventory fell further as sales outpaced new listings
Single-family home and condo inventory has been trending lower for the past 12 months. Inventory showed some initial signs of growth in the first quarter before declining in April and May. Sales grew from April to May while new listings declined for the second month in a row. Additionally, inventory, sales, and new listings are all significantly lower than last year. The number of home sales is, in part, a function of the number of active listings and new listings coming to market. Even though new listings are at a depressed level, any amount of new listings positively affect sales. Currently, inventory is so low relative to demand that far more new listings could come to the market. Potential sellers who have fully paid off their property are in a particularly good position if they don’t have to finance their next property after the sale of their home. Since January, sales jumped 115% while new listings declined 23%.
As buyer competition has ramped up and sellers are gaining negotiating power, sellers are receiving more of their listed price. In January 2023, the average seller received 96% of list price compared to 100% of list in May. Inventory will almost certainly remain depressed for the rest of the year, and the market will likely only get more competitive in the summer months.
-----
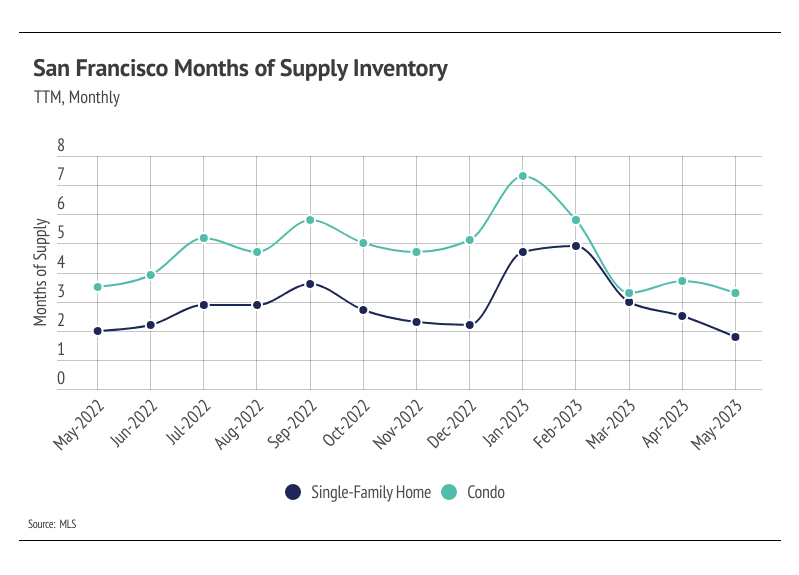
Months of Supply Inventory indicates a sellers’ market for single-family homes and a balanced market for condos
Months of Supply Inventory (MSI) quantifies the supply/demand relationship by measuring how many months it would take for all current homes listed on the market to sell at the current rate of sales. The long-term average MSI is around three months in California, which indicates a balanced market. An MSI lower than three indicates that there are more buyers than sellers on the market (meaning it’s a sellers’ market), while a higher MSI indicates there are more sellers than buyers (meaning it’s a buyers’ market). The San Francisco market tends to favor sellers, at least for single-family homes, which is reflected in its low MSI. However, we’ve seen over the past 12 months that this isn’t always the case. The MSI indicated that single-family homes and condos began the year in a buyers’ market. MSI has declined sharply since January for both single-family homes and condos, indicating that the climate has shifted from a buyers’ market to a sellers’ market for single-family homes and a balanced market for condos. The sharp drop in MSI occurred due to the higher proportion of sales relative to active listings and less time on the market.